Microsoft Word MCQs
This question is based upon the figure shown below
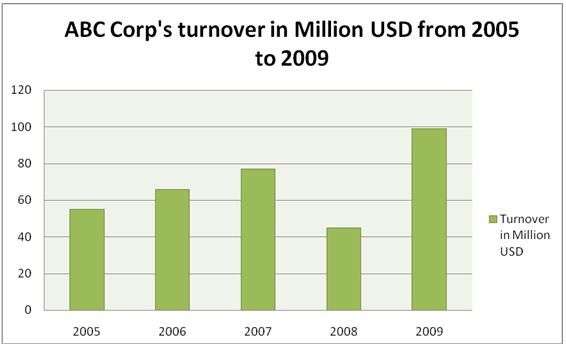 |
| Sarah receives a company turnover summary in the form of an embedded Excel chart (as shown in the above image) in a Microsoft Word 2010 document from her boss. Her boss wants the chart to be sent over to the Public Relations department with a line in the chart showing the variations in the company's turnover, as well as a prediction for the next 2 years. The turnover values for each year also need to be sent separately in an Excel file. What should Sarah do to achieve this in the shortest possible time? |
Answer
Correct Answer: Use the Trendline feature to create a line showing the trends and copy the data from the Excel sheet field which opens up on clicking Edit Data.
Explanation:
Note: This Question is unanswered, help us to find answer for this one

More Microsoft Word MCQ Questions


