Skill Assessments for Free
Assess your skill, Practice with MCQs or just learn for fun. Quizack is a platform to brush up your knowledge and prepare you for any upcoming exam or job interview.


Skill Assessments
Try our free Quizzes to assess your skills

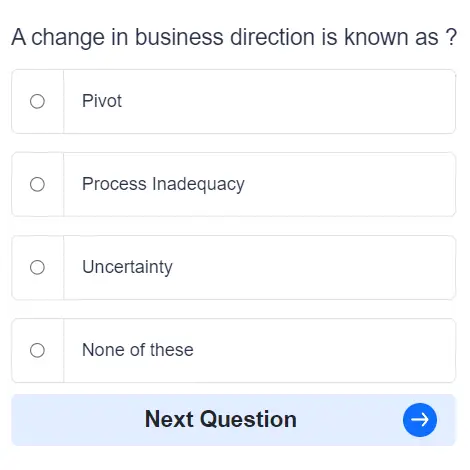
Practice MCQs
Boost your skills with 1000s of MCQs in practice mode

Categories
Huge range covering almost all online skill & academic subjects

Earn Certification
Complete Skill Assessments and earn certifications
What you want to learn today?
1000+
Skills
4000+
Subjects
10,000
Quizzes
100,000+
MCQs